


Hungarian Economy
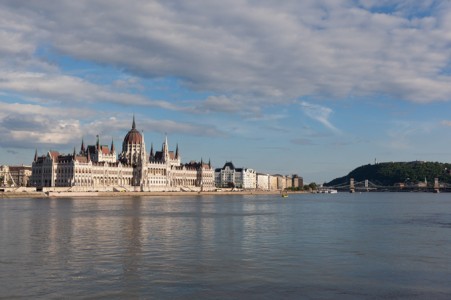
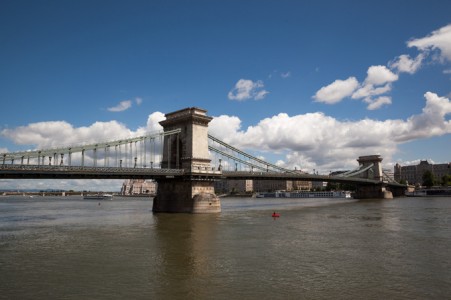
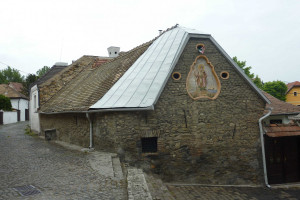
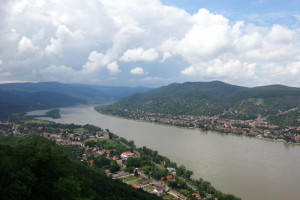
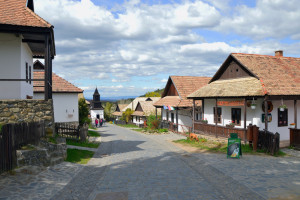
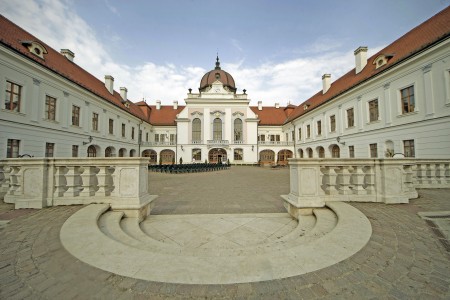
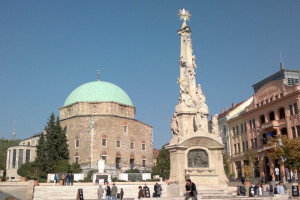
ZoOm Hungary
Hungary has made the transition from a centrally planned to a market economy, with a per capita income nearly two-thirds that of the EU-28 average. In 2010 the government implemented a number of changes including cutting business and personal income taxes, but imposed ’crisis taxes’ on financial institutions, energy and telecom companies, and retailers.
In late 2008, Hungary's impending inability to service its short-term debt – brought on by the global financial crisis – led Budapest to obtain an IMF/EU/World Bank-arranged financial assistance package worth over $25 billion. The global economic downturn, declining exports, and low domestic consumption and fixed asset accumulation, dampened by government austerity measures, resulted in a severe economic contraction in 2009. In 2010 the new government implemented a number of changes including cutting business and personal income taxes, but imposed ’crisis taxes’ on financial institutions, energy and telecom companies, and retailers.
Hungarian Economy
$321.869 billion (2019 est.)
$307.778 billion (2018 est.)
$291.995 billion (2017 est.)
Country comparison to the world: 54
GDP (official exchange rate): $163.251 billion (2019 est.)
4.58% (2019 est.)
5.44% (2018 est.)
4.45% (2017 est.)
Country comparison to the world: 60
GDP – per capita (PPP):
$32,945 (2019 est.)
$31,485 (2018 est.)
$29,832 (2017 est.)
Country comparison to the world: 54
GDP – composition by sector:
agriculture: 3.9% industry: 31.3% services: 64.8% (2017 est.)
Labor force:
4.414 million (2020 est.)
Country comparison to the world: 85
Labor force – by occupation:
agriculture: 4.9% industry: 30.3% services: 64.5% (2015)
Unemployment rate:3.45% (2019 est.)
Agricultural products:
wheat, corn, sunflower seed, potatoes, sugar beets; pigs, cattle, poultry, dairy products
Industries:
mining, metallurgy, construction materials, processed foods, textiles, chemicals (especially pharmaceuticals), motor vehicles
Exports: $91.6 billion (2016 est.) Country comparison to the world: 36
Partners: Germany 28.2%, Romania 5.2%, Slovakia 5%, Austria 4.9%, France 4.8%, Italy 4.8%, Czech Republic 4.2%, Poland 4.2% (2016)
Imports: $85.78 billion (2016 est.)
Country comparison to the world: 36
Partners: Germany 26.3%, Austria 6.4%, China 6.3%, Poland 5.5%, Slovakia 5.3%, Netherlands 4.9%, Czech Republic 4.9%, France 4.8%, Italy 4.8% (2016)
Reserves of foreign exchange and gold:
$28 billion (31 December 2017 est.)
$25.82 billion (31 December 2016 est.)
Country comparison to the world: 52
Public Debt:
73.6% of GDP (2017 est.)
76% of GDP (2016 est.)
Country comparison to the world: 43